Alert Forwarding (Alertmanager)
NudgeBee investigates the alerts you already have. To get them, your Alertmanager has to POST them to the agent. The agent Helm chart cannot set this up, because the configuration lives in your Alertmanager.
If you skip it, nothing breaks visibly. Metrics are pulled, so a bad Prometheus URL shows up right away. Alerts are pushed, so when no receiver targets the agent, all the pods stay healthy, no error is logged, and NudgeBee just never raises an alert-driven event. If your cluster shows metrics and workloads but no alerts, start here.
The address alerts go to
http://<release>-runner.<agent-namespace>.svc/api/alerts
With the default install (release nudgebee-agent in namespace nudgebee-agent):
http://nudgebee-agent-runner.nudgebee-agent.svc/api/alerts
helm install prints the URL for your release. To look it up later:
kubectl get svc -A -l component=runner
The Service listens on port 80 and forwards to the runner's 5000, so the URL needs no port.
Find your Alertmanager
kubectl get alertmanagers.monitoring.coreos.com -A
kubectl get thanosrulers.monitoring.coreos.com -A
kubectl get vmalertmanagers.operator.victoriametrics.com -A
kubectl get svc,deploy,sts -A | grep -Ei 'alertmanager|thanos-rule|thanos-quer'
| What you have | Section |
|---|---|
| Prometheus installed from the NudgeBee values file | kube-prometheus-stack |
An Alertmanager CR from prometheus-operator, often next to Thanos | Operator-managed Alertmanager |
| Alertmanager as a Deployment with a ConfigMap | Plain Alertmanager |
| No Alertmanager, metrics in a managed backend | VMAlert + VMAlertmanager |
| Alertmanager in another cluster or a SaaS | External Alertmanager |
The config to add
Every in-cluster option below adds the same route and receiver:
route:
  routes:
    - receiver: nudgebee-agent
      group_by: ['...']
      group_wait: 1s
      group_interval: 1s
      repeat_interval: 4h
      continue: true

receivers:
  - name: nudgebee-agent
    webhook_configs:
      - url: 'http://nudgebee-agent-runner.nudgebee-agent.svc/api/alerts'
        send_resolved: true
Add the route to your existing route.routes list and the receiver to your existing receivers list. Do not replace either list.
continue: true is not optional. Without it the first matching route wins and your PagerDuty and Slack receivers stop getting alerts. That is the usual way this change breaks a working setup.
group_by: ['...'] turns off grouping for this route. NudgeBee groups and correlates alerts on its own side, and grouping in Alertmanager first throws away the labels it needs. It also means each notification carries a single alert, so you do not need max_alerts — and should not set it, since it truncates rather than splits.
kube-prometheus-stack
The NudgeBee values file already contains the receiver, so an install from it needs nothing extra:
helm upgrade --install nudgebee-prometheus prometheus-community/kube-prometheus-stack \
  -n nudgebee-agent --create-namespace \
  -f https://raw.githubusercontent.com/nudgebee/k8s-agent/main/kube-prometheus-stack-values.yaml
One catch: a values file cannot template, so the URL in it is hardcoded to nudgebee-agent-runner.nudgebee-agent.svc. It resolves only if your agent release is named nudgebee-agent in a namespace of the same name. With any other name, download the file, replace that URL with the one helm install printed, and install from your copy. When the URL does not resolve, Alertmanager logs the failed sends and fires AlertmanagerFailedToSendAlerts, but NudgeBee has no way to tell you it is missing alerts.
If you already run kube-prometheus-stack and did not install it from that file, add the route and receiver under alertmanager.config in your own values:
helm -n <ns> get values <release> -o yaml > /tmp/values.yaml
# add the route and receiver under alertmanager.config
helm -n <ns> upgrade <release> prometheus-community/kube-prometheus-stack -f /tmp/values.yaml
Operator-managed Alertmanager
Most platform stacks look like this, including clusters that read metrics from Thanos: an Alertmanager CR runs Alertmanager, and Prometheus (usually with a Thanos sidecar) or a Thanos Ruler sends alerts to it. Thanos has no alert routing of its own, so Alertmanager is the only thing you change.
Its config lives in a Secret named alertmanager-<CR name>, key alertmanager.yaml, unless spec.configSecret points somewhere else:
NS=<alertmanager-namespace>; AM=<alertmanager-cr-name>

# where does the CR read its config from?
kubectl -n $NS get alertmanager $AM -o yaml | grep -E 'configSecret|alertmanagerConfiguration|ConfigSelector'

# current config
kubectl -n $NS get secret alertmanager-$AM -o jsonpath='{.data.alertmanager\.yaml}' | base64 -d > /tmp/am.yaml
Add the route and receiver to /tmp/am.yaml, then put it back:
kubectl -n $NS create secret generic alertmanager-$AM \
  --from-file=alertmanager.yaml=/tmp/am.yaml \
  --dry-run=client -o yaml | kubectl apply -f -
The operator rebuilds the generated Secret and the config-reloader sidecar picks it up on its own, usually within a minute. No restart needed. If Alertmanager rejects the new config it keeps serving the old one, so confirm with the verification steps instead of assuming it took.
Things that trip people up here:
- The dump came back empty. Newer operators gzip the config. Use the key
alertmanager.yaml.gz, pipe throughgunzipto read it andgzip -cto write it back. - The Secret does not exist. The operator is running its built-in default config. Create the Secret with a full config: a top-level
routewith areceiver, areceiverslist, and the NudgeBee entries. - Something manages this cluster's manifests. Check
metadata.annotationsformeta.helm.sh/*orargocd.argoproj.io/*. If Helm, Argo CD, or Flux owns the Secret, make the change in that source repo or yourkubectl applygets reverted on the next sync. - Alertmanager is older than v0.22. It does not understand the
matcherslist syntax. Usematch_re: { severity: ".*" }if the route needs a matcher.
Thanos Ruler
If a Thanos Ruler evaluates your rules instead of Prometheus, check that it sends to this Alertmanager. If it does not, the rules it evaluates never reach NudgeBee no matter how the receiver is configured:
kubectl -n <ns> get thanosruler -o yaml | grep -A8 -i alertmanager
kubectl -n <ns> get sts <thanos-ruler> -o yaml | grep -- 'alertmanagers.url'
# expected: http://alertmanager-operated.<ns>.svc:9093
Plain Alertmanager
Alertmanager running as a Deployment or StatefulSet with its config in a ConfigMap:
kubectl -n <ns> get cm <am-configmap> -o jsonpath='{.data.alertmanager\.yml}' > /tmp/am.yml
# edit /tmp/am.yml, then
kubectl -n <ns> create configmap <am-configmap> --from-file=alertmanager.yml=/tmp/am.yml \
  --dry-run=client -o yaml | kubectl apply -f -

# reload without a restart
kubectl -n <ns> exec deploy/<am> -- wget -qO- --post-data='' http://localhost:9093/-/reload
A ConfigMap mounted as a volume can take a minute or two to update inside the pod, so the reload may need a second attempt.
VMAlert + VMAlertmanager
Use this when the cluster has no Alertmanager at all, which is common when metrics live in a managed backend such as Chronosphere, Grafana Cloud, or Amazon Managed Prometheus. VMAlert evaluates rules against the remote datasource and VMAlertmanager routes what fires.
1. Store the credential VMAlert queries with
VMAlert reads your metrics backend directly, so it authenticates however that backend expects. The example below passes a bearer token, which covers most hosted Prometheus APIs:
kubectl create secret generic metrics-datasource-secret \
  --from-literal=api-token=<YOUR_API_TOKEN> \
  -n nudgebee-agent
If your backend uses basic auth or OAuth2 instead, VMAlert takes datasource.basicAuth or datasource.oauth2 in place of the bearer token below. None of this involves the NudgeBee agent, which only receives what VMAlertmanager forwards.
2. Install
helm repo add vm https://victoriametrics.github.io/helm-charts/
kubectl apply -f https://raw.githubusercontent.com/VictoriaMetrics/helm-charts/refs/tags/victoria-metrics-single-0.23.0/charts/victoria-metrics-operator/charts/crds/crds/crd.yaml
helm upgrade --install vma vm/victoria-metrics-k8s-stack --version 0.57.0 -f vm-operator.yaml -n nudgebee-agent
3. vm-operator.yaml
Point datasource.url at the query endpoint the agent already uses (globalConfig.prometheus_url). Everything else the VictoriaMetrics stack can install is turned off here, so this release only evaluates rules and routes alerts.
victoria-metrics-operator:
  enabled: true

defaultDashboards:
  enabled: false

defaultRules:
  create: false

vmsingle:
  enabled: false

vmcluster:
  enabled: false

alertmanager:
  enabled: true
  config:
    route:
      receiver: "blackhole"
      group_by: ["alertname"]
      group_wait: 30s
      group_interval: 5m
      repeat_interval: 12h
      routes:
        - receiver: 'nudgebee-agent'
          group_by: [ '...' ]
          group_wait: 1s
          group_interval: 1s
          repeat_interval: 4h
          matchers:
            - severity =~ ".*"
          continue: true
    receivers:
      - name: blackhole
      - name: 'nudgebee-agent'
        webhook_configs:
          - url: 'http://nudgebee-agent-runner.nudgebee-agent.svc/api/alerts'
            send_resolved: true

vmalert:
  enabled: true
  spec:
    datasource:
      url: "<your-metrics-query-endpoint>"
    notifiers:
    - url: http://vmalertmanager-vma-victoria-metrics-k8s-stack.nudgebee-agent.svc:9093
    selectAllByDefault: true
    evaluationInterval: 20s
    extraArgs:
      envflag.enable: "true"
      envflag.prefix: "VM_"
    env:
      - name: VM_datasource_bearerToken
        valueFrom:
          secretKeyRef:
            name: metrics-datasource-secret
            key: api-token

vmauth:
  enabled: false
vmagent:
  enabled: false
grafana:
  enabled: false
prometheus-node-exporter:
  enabled: false
kube-state-metrics:
  enabled: false
kubelet:
  enabled: false
kubeApiServer:
  enabled: false
kubeControllerManager:
  enabled: false
kubeDns:
  enabled: false
coreDns:
  enabled: false
kubeEtcd:
  enabled: false
kubeScheduler:
  enabled: false
kubeProxy:
  enabled: false
VMAlert only needs datasource and notifiers to evaluate rules and route what fires. Add remoteWrite and remoteRead pointing at your backend's remote-write and remote-read endpoints if you also want recording-rule results persisted and alert state restored across restarts; neither is required for forwarding to NudgeBee.
The token stays out of the manifest: -envflag.enable with prefix VM_ makes VictoriaMetrics read VM_datasource_bearerToken from the environment, which comes from the Secret.
kubectl get vmalert,vmalertmanager,pods -n nudgebee-agent
External Alertmanager
A .svc address only resolves inside the cluster. If Alertmanager runs somewhere else — a central Alertmanager for many clusters, Grafana Cloud, Chronosphere — send alerts to the public webhook instead.
1. Create the webhook in NudgeBee
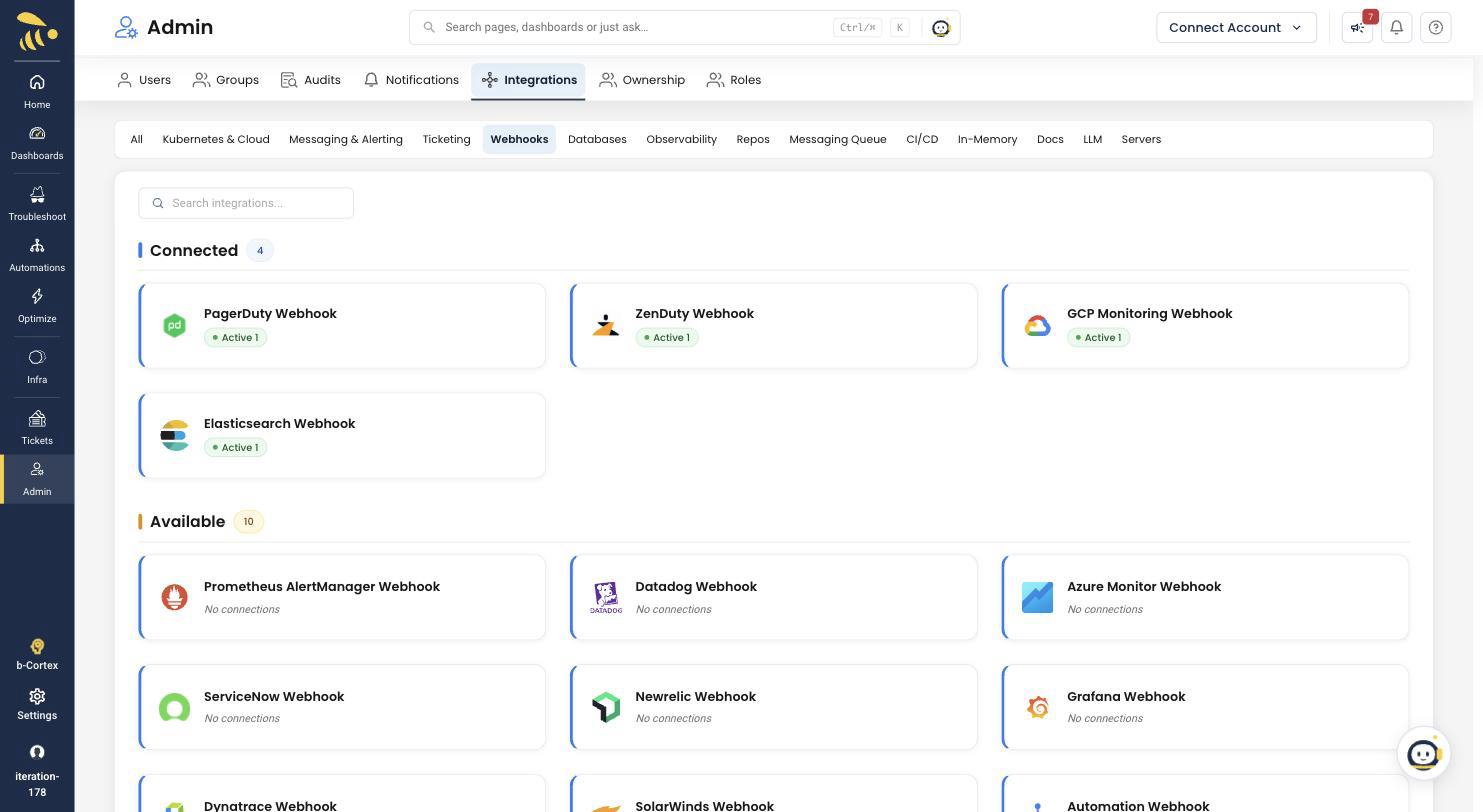
Open Admin → Integrations, switch to the Webhooks tab, and click the Prometheus AlertManager Webhook card under Available.
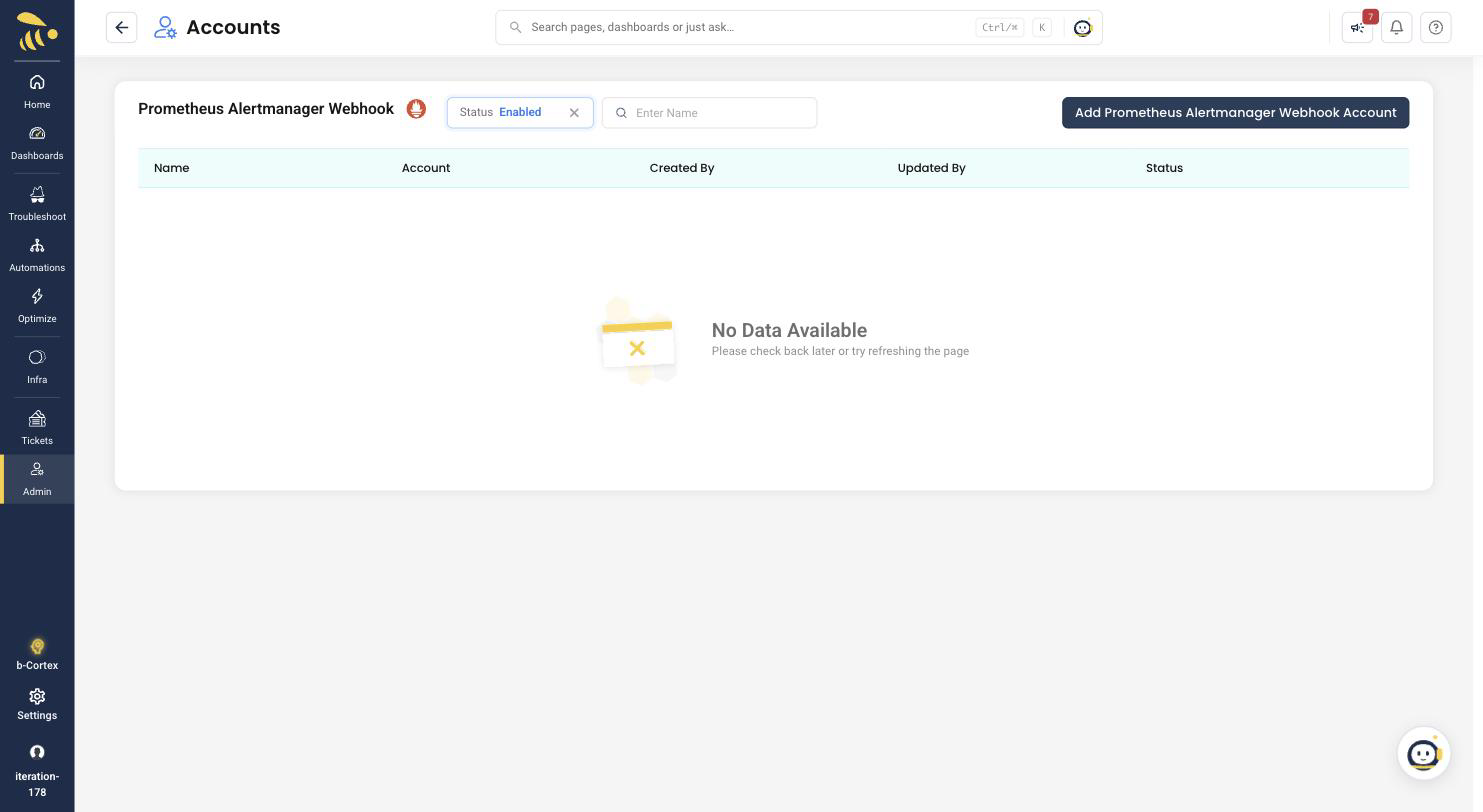
Click Add Prometheus Alertmanager Webhook Account.
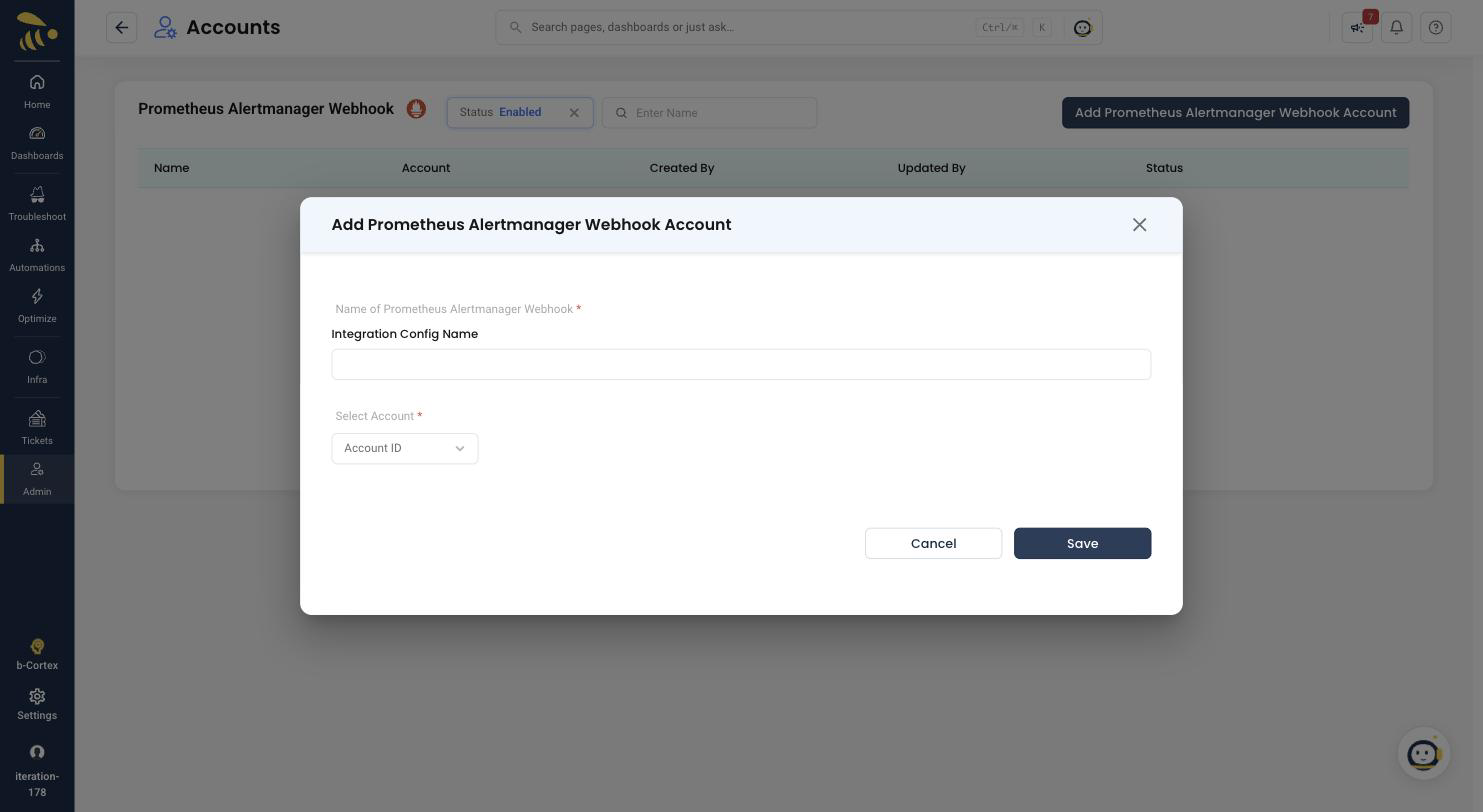
Give it a name you will recognise later, pick the account this cluster reports to, and save.
NudgeBee then shows the webhook URL for this integration. Copy it. The token in it is a credential — treat it like a password.
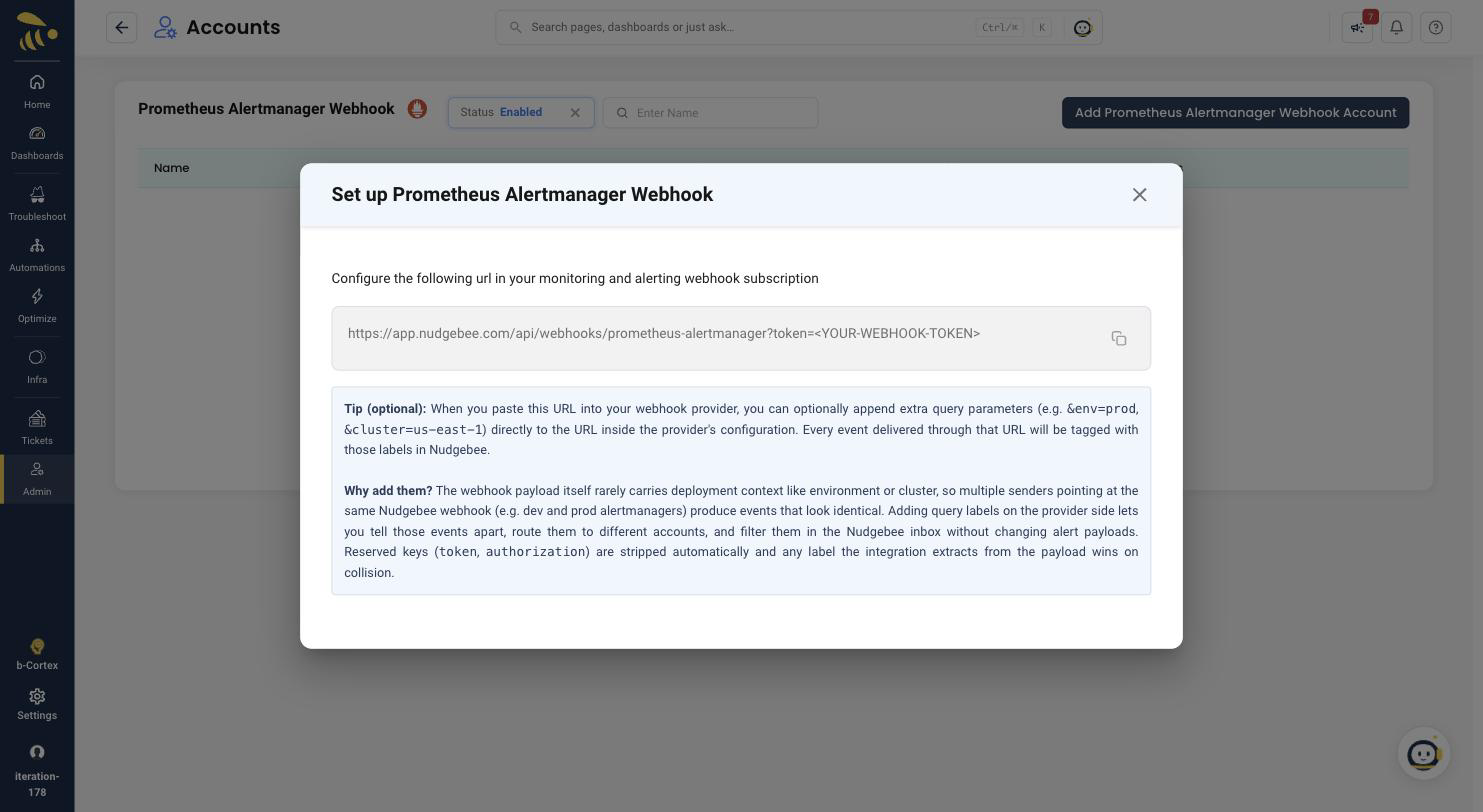
You can append your own query parameters to that URL, and every event delivered through it is tagged with them in NudgeBee. That is worth doing when more than one Alertmanager posts to the same webhook, since the alert payload itself carries no deployment context:
...?token=<token>&env=prod&cluster=us-east-1
token and authorization are reserved and stripped. If the payload already carries a label the integration extracts, the payload wins.
2. Point Alertmanager at it
receivers:
  - name: nudgebee
    webhook_configs:
      - url: 'https://<your-nudgebee-domain>/api/webhooks/prometheus-alertmanager?token=<token>'
        send_resolved: true
To keep the token out of the URL, send it as a header instead. Both work:
        http_config:
          authorization:
            type: Bearer
            credentials: '<token>'
If one Alertmanager serves several clusters, split the traffic rather than sending everything to one destination. Add a route per cluster matching on the external label your Prometheus or Ruler sets (cluster, prometheus, or whatever you configured), and give each route its own receiver — either the in-cluster agent for that cluster, or the same public webhook with a different &cluster= query label so NudgeBee can tell the events apart.
This matters most when the receiver is an in-cluster agent: the agent stamps every alert it accepts with its own cluster name, so alerts from cluster B arriving at cluster A's agent are attributed to cluster A and name resources that do not exist there.
Using an AlertmanagerConfig CR
If your platform manages Alertmanager entirely through CRs, you can route to NudgeBee that way — but not by simply creating an AlertmanagerConfig in the agent's namespace. That is the one arrangement that quietly does the wrong thing.
The operator injects a namespace=<the CR's own namespace> matcher into every route it generates from an AlertmanagerConfig. A CR in the agent's namespace therefore forwards only alerts that originated in that namespace. NudgeBee receives a trickle, which reads as "mostly working" rather than as a broken config.
What controls this is spec.alertmanagerConfigMatcherStrategy.type on the Alertmanager resource:
| Value | Effect |
|---|---|
OnNamespace (default) | Every AlertmanagerConfig is restricted to alerts from its own namespace. |
OnNamespaceExceptForAlertmanagerNamespace | Same, except CRs living in the Alertmanager's own namespace, which process all alerts. Needs prometheus-operator v0.84.0 or newer. |
None | No namespace matcher for anyone. Any namespace can route any alert. |
That leaves two workable CR-based routes.
Put the CR next to the Alertmanager. Set the strategy to OnNamespaceExceptForAlertmanagerNamespace and create the AlertmanagerConfig in the Alertmanager's namespace. Your platform CR routes cluster-wide while application teams' CRs stay scoped to their own namespaces.
apiVersion: monitoring.coreos.com/v1
kind: Alertmanager
spec:
  alertmanagerConfigMatcherStrategy:
    type: OnNamespaceExceptForAlertmanagerNamespace
With kube-prometheus-stack, that lives under alertmanager.alertmanagerSpec.alertmanagerConfigMatcherStrategy in your values.
Then the config itself, in the same namespace as the Alertmanager:
apiVersion: monitoring.coreos.com/v1alpha1
kind: AlertmanagerConfig
metadata:
  name: nudgebee-agent
  namespace: <alertmanager-namespace>
spec:
  route:
    receiver: nudgebee-agent
    groupBy: ['...']
    groupWait: 1s
    groupInterval: 1s
    repeatInterval: 4h
  receivers:
    - name: nudgebee-agent
      webhookConfigs:
        - url: http://nudgebee-agent-runner.nudgebee-agent.svc/api/alerts
          sendResolved: true
Note the field names differ from raw Alertmanager config — camelCase, and sendResolved rather than send_resolved. You do not need continue: true here: the operator forces it on the first-level route of every AlertmanagerConfig, so this route cannot swallow alerts from your other receivers.
Or make one CR the base config. Point spec.alertmanagerConfiguration.name at an AlertmanagerConfig in the Alertmanager's namespace. The operator generates the whole configuration from it and does not enforce a namespace label on its routes.
spec:
  alertmanagerConfiguration:
    name: platform-alertmanager-config
Do not reach for None to fix this. It drops the namespace restriction for every AlertmanagerConfig in the cluster, not only yours.
On an operator older than v0.84.0 that is not using alertmanagerConfiguration, there is no CR-based way to route cluster-wide — edit the base config Secret instead, as in Operator-managed Alertmanager.
Verify
# 1. Is the route actually loaded? This reads the running config.
kubectl -n <ns> exec sts/alertmanager-<am-name> -c alertmanager -- \
  amtool config routes show --alertmanager.url=http://localhost:9093

# 2. Can Alertmanager reach the agent? Catches NetworkPolicy blocks.
#    A 202 means yes.
kubectl -n <ns> exec sts/alertmanager-<am-name> -c alertmanager -- \
  wget -S -qO- --post-data='{}' --header='Content-Type: application/json' \
  http://nudgebee-agent-runner.nudgebee-agent.svc/api/alerts

# 3. Is the agent receiving anything?
kubectl -n nudgebee-agent logs deploy/nudgebee-agent-runner --tail=100 | grep -i alert
The most useful check is to push a synthetic alert through Alertmanager itself. It exercises the whole path — route matching, your receiver, the agent's intake — without waiting for something real to fire:
kubectl -n <ns> exec sts/alertmanager-<am-name> -c alertmanager -- \
  amtool alert add NudgeBeeDeliveryTest severity=warning namespace=default \
    --annotation=summary='verifying alert delivery to NudgeBee' \
    --alertmanager.url=http://localhost:9093
It should appear in NudgeBee within a minute or two. If it does not, run step 1 again and read the route tree in order: the first route that matches without continue: true is where the alert stopped.
Clean up afterwards by expiring it, or leave it — Alertmanager drops an alert with no endsAt five minutes after it stops being refreshed.
To test the agent by itself, POST an alert straight at it. The endpoint answers 202 as soon as it has read the body and forwards to NudgeBee in the background, so read the runner logs alongside it:
kubectl -n nudgebee-agent port-forward svc/nudgebee-agent-runner 8080:80 &
curl -si -XPOST localhost:8080/api/alerts -H 'Content-Type: application/json' -d '{
 "version":"4","status":"firing","receiver":"nudgebee-agent","groupLabels":{},
 "commonLabels":{},"commonAnnotations":{},"externalURL":"","alerts":[
 {"status":"firing","labels":{"alertname":"NudgeBeeIntakeTest","severity":"warning","namespace":"default","pod":"test"},
  "annotations":{"description":"manual intake test"},"startsAt":"2024-01-01T00:00:00Z"}]}'
Delivery is confirmed when a real alert that is currently firing in Alertmanager also appears in NudgeBee. Compare the two: open Alertmanager's own UI, pick something firing now, and look for it in NudgeBee.
If AlertmanagerFailedToSendAlerts is firing, Alertmanager is trying and failing to reach the receiver — the URL is wrong or blocked, and step 2 above will show it.
One routing trap to rule out first: Alertmanager stops at the first matching route unless that route sets continue: true. If a route above yours matches the same alerts, yours never runs. amtool config routes show in step 1 prints the tree in evaluation order.