Chronosphere
Prerequisites
Before configuring the integration, ensure you have the following from your Chronosphere account:
- Your Chronosphere tenant URL (e.g.,
https://<tenant>.chronosphere.io) - A Chronosphere API token (Bearer token) with read access to metrics and traces
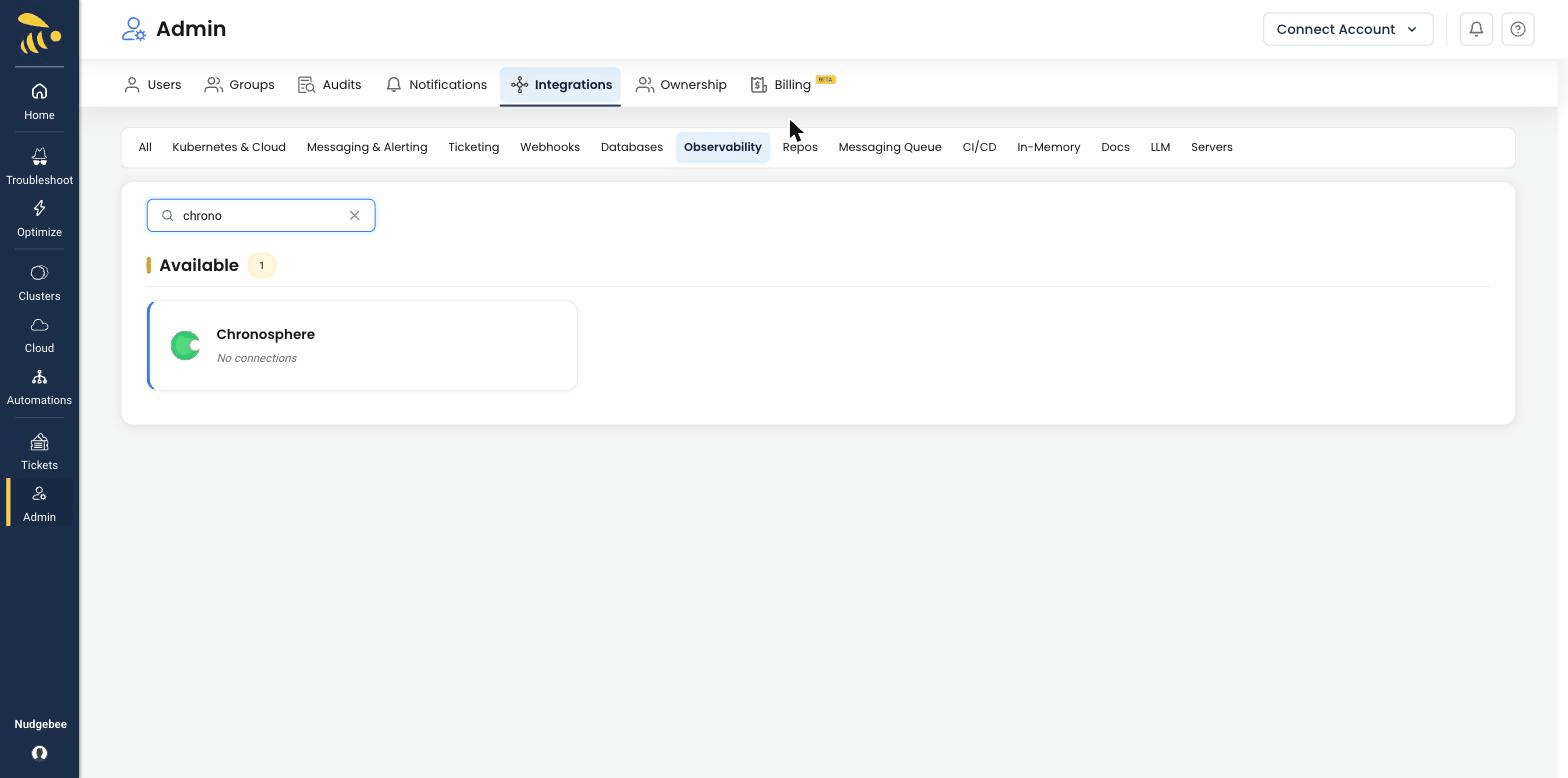
Chronosphere Integration Configuration
Navigate to Integrations > Observability tab and select Chronosphere to open the configuration form.
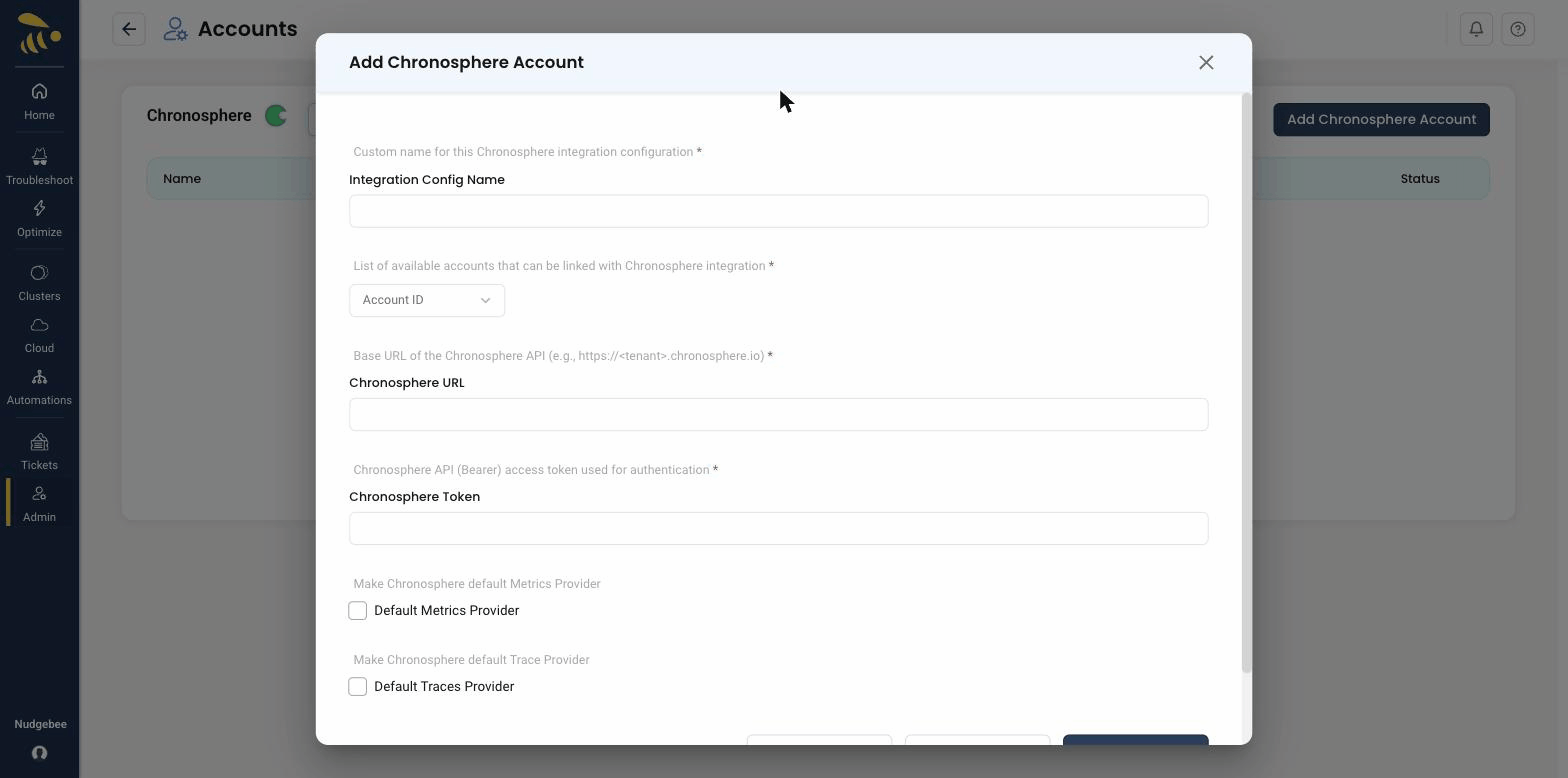
Configuration Fields
-
Account Id
- Select the NudgeBee account to link with this Chronosphere integration from the dropdown.
-
Integration Config Name
- A descriptive name for this integration (e.g.,
Production Chronosphere). - Used to identify this configuration when multiple Chronosphere integrations exist.
- A descriptive name for this integration (e.g.,
-
Chronosphere URL * (Required)
- The base URL of your Chronosphere tenant API.
- Format:
https://<tenant>.chronosphere.io - You can find this in your browser address bar when logged into Chronosphere.
-
Chronosphere Token * (Required)
- A Chronosphere API Bearer access token used for authentication.
- To generate one: in Chronosphere, navigate to Settings > API Tokens > Create Token. Ensure the token has read permissions for metrics and traces.
-
Default Metrics Provider
- Enable this to set Chronosphere as the default source for metric queries across NudgeBee.
-
Default Traces Provider
- Enable this to set Chronosphere as the default source for distributed trace queries.
What Gets Connected
Once configured, NudgeBee queries your Chronosphere tenant for both metrics and traces:
| Signal | Query Language | Example |
|---|---|---|
| Metrics | PromQL | rate(http_requests_total{service="checkout"}[5m]) |
| Traces | Trace API | Query spans by trace ID, service name, or time range |
Metrics Capabilities
- Label discovery — fetch available metric labels with optional time range and metric name filtering
- Label values — retrieve distinct values for a given label
- PromQL queries — full PromQL support for instant and range queries
- Time-series visualization — supports configurable step intervals
Traces Capabilities
- Trace lookup — query individual traces by trace ID
- Span search — find traces by service name, operation, duration, or status
- Heatmap visualization — trace duration heatmaps for performance analysis
Deployment Models
Chronosphere supports two deployment models in NudgeBee:
| Model | Source | Description |
|---|---|---|
| SaaS | user | Direct API connection to your Chronosphere cloud tenant using URL + token |
| Agent | agent | Queries routed through the NudgeBee relay server (for self-hosted or private network deployments) |
The SaaS model is configured through this integration form. The agent model is configured through the NudgeBee K8s collector.
Verify the Integration
- Save the configuration. If the URL and token are valid, the integration is created without errors.
- Navigate to any Kubernetes workload in NudgeBee.
- Open the Metrics or Traces tab.
- Confirm that data from Chronosphere appears in the query results.
Notes
- Chronosphere uses PromQL for metrics queries, making it compatible with Prometheus-based dashboards and alerts.
- Trace data is queried using Chronosphere's native trace API with OpenTelemetry-compatible span attributes.
- Both instant queries and range queries with configurable step sizes are supported for metrics.