Troubleshooting
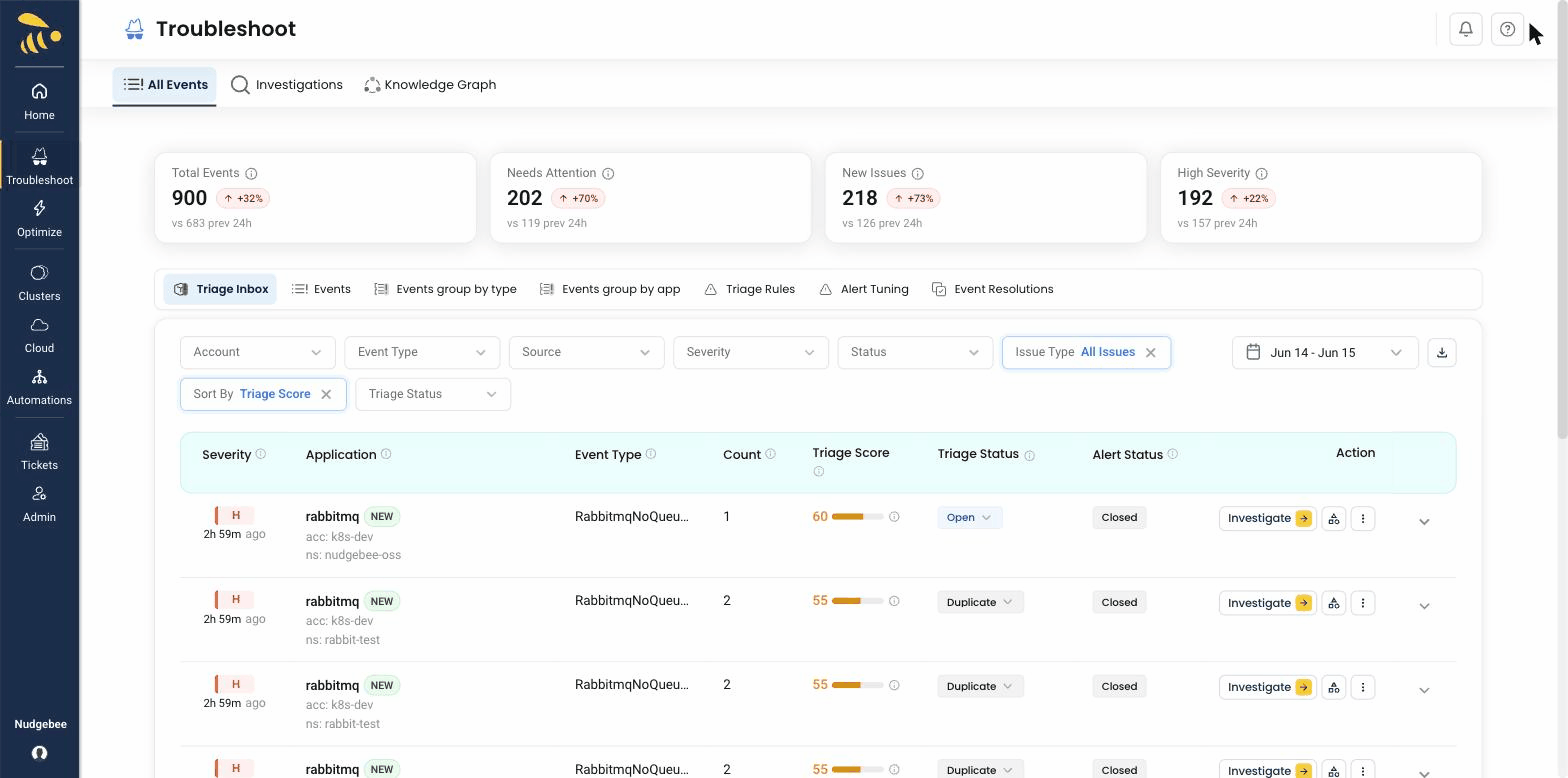
NudgeBee's troubleshooting dashboard gives you a real-time view of events, errors, and anomalies across all your connected Kubernetes clusters. Instead of switching between multiple monitoring tools, you get a single pane of glass — powered by the Semantic Knowledge Graph — that correlates metrics, logs, traces, and code to help you find the root cause of issues faster, reducing MTTR from hours to minutes.
What You Can Do Here
- Monitor real-time events — See pod crashes, OOM kills, deployment failures, and other Kubernetes events as they happen.
- AI-powered root cause analysis with NuBi — When an LLM is connected, NuBi (the SRE AI Agent) and NudgeBee's pre-built AI agents automatically analyze incidents, correlate signals across the Semantic Knowledge Graph, and suggest root causes in plain language.
- Explore the Semantic Knowledge Graph — Visualize your infrastructure dependencies and trace how issues propagate across services. See Semantic Knowledge Graph.
- Configure alerting rules — Set up custom alerting rules to get notified when specific conditions are met. See Alerting.
- Attach event playbooks — Run evidence-collection actions (logs, metrics, custom SQL, kubectl, cloud CLI, SSH, …) automatically on each event so the LLM has the data it needs. See Playbook Catalog.
- Understand the split between playbooks and workflows — Playbooks gather evidence for the LLM; workflows post-process the resulting event (triage, ticketing, remediation). See Event Playbooks vs Workflows.
info
Prerequisites: To use troubleshooting features, you need at least one Kubernetes cluster connected and an observability source integrated. For AI-powered analysis, an LLM connection is also needed.
Watch a Walkthrough
What You Will Find in This Section
- Event Playbooks vs Workflows — Conceptual guide to the two automation surfaces and when to use each.
- Alerting — Configure custom alerting rules and attach playbook actions for auto-triage.
- Playbook Catalog — Full reference of every event-playbook action and its parameters, including custom data-collection (proxy DB query, cloud CLI, SSH, kubectl).
- Templating & Best Practices — Use gonja (Jinja-style) templates in action parameters, with patterns for labels, outputs, conditionals, and
for_eachloops.