Kubernetes
Each connected Kubernetes cluster has its own page with six tabs: Summary, Optimize, Troubleshoot, Apps & Infra, Monitoring and Security & Tools. This page explains how to get there, what each tab holds, and why a tab can be missing or grayed out.
info
Prerequisite: At least one Kubernetes cluster must be connected via the NudgeBee Agent or through a cloud account.
Getting to a cluster
- Infra → K8s in the sidebar opens the cluster selected in the header's account picker (or the one you used last, or the first one). With no cluster connected it goes to Account Overview.
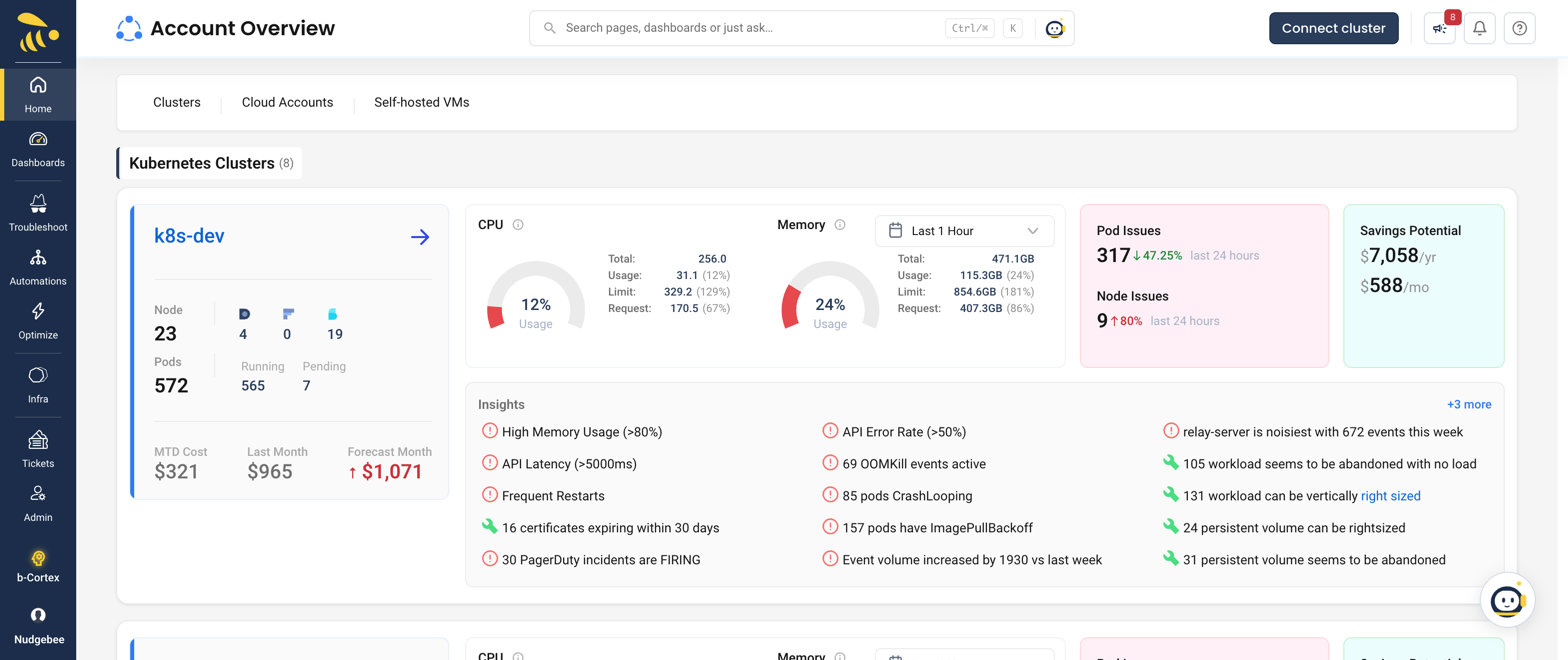
- Home → Account Overview lists every connected account — Kubernetes Clusters, Cloud Accounts and Self-hosted VMs. Each cluster card shows its name; MTD Cost, Last Month and Forecast Month; node counts (on-demand and spot); pod counts by status; CPU and memory trends (usage, total, request, limit); Pod Issues and Node Issues; savings; and Insights. With nothing connected, users with write access get Show me how, Add Cluster and Connect Cloud Account; others see a message asking an admin to connect an account.
- Global search (Ctrl/⌘+K) jumps straight to any tab.
The cluster tabs
| Tab | Sub-tabs | Page |
|---|---|---|
| Summary | Cluster Summary, Cost Summary, Utilization | below |
| Optimize | Summary, Right Sizing, Auto Scaler, Unused Volumes, Best Practices, Abandoned Apps, PVC Rightsizing, Replica Rightsizing, Spot Recommendations, Recommendation Resolution | Optimize, Auto Scaler |
| Troubleshoot | Summary, Triage Inbox, Events - By Type, Pod Errors, Node Errors, Application Errors, All Events, Anomaly, Triage Rules, Service Criticality | Troubleshoot, Anomaly |
| Apps & Infra | Nodes, Applications, Pods, Namespace, Services, PVC, PV, Databases, Queues | Workloads & Pods |
| Monitoring | Query Log, Log Groups, Query Metrics, Alert Manager, Service Map, Traces, Trace Group, Cross-Zone Communication, SLO, Grafana | Logs, Traces & Service Map, Alert Manager |
| Security & Tools | Image Scan, CIS Scan, Sensitive Logs, Cluster Upgrade, Upgrade Planner, Certificate Issues, Helm Upgrade | Security & Upgrades |
Search names vs tab names
Global search uses slightly different names for some tabs. On the page, look for the tab name:
| Search finds | Tab is called |
|---|---|
| Abandoned Resources | Abandoned Apps |
| Unused Volume | Unused Volumes |
| PV Rightsizing | PVC Rightsizing |
| Spot Recommendation | Spot Recommendations |
| App Errors | Application Errors |
| Namespaces | Namespace |
| DBMS | Databases |
| Queue | Queues |
| Query Logs | Query Log |
| Trace Grouping | Trace Group |
| Cross Zone | Cross-Zone Communication |
| SSL Certificate Issues | Certificate Issues |
Why a tab is grayed out or missing
- Custom roles. Users whose access comes only from a custom role need read access to the matching module: k8s for Summary and Apps & Infra, recommendations for Optimize, events for Troubleshoot, logs for Monitoring, security for Security & Tools. Some sub-tabs need their own module: Anomaly (anomalies), Service Criticality (workload), Query Metrics (metrics), Alert Manager (alertmanager), Service Map, Traces, Trace Group and Cross-Zone (traces), SLO (slo). A sub-tab you can't open is grayed out; a tab with nothing you can open is disabled. Tenant and account roles see every tab.
- Write access. Buttons and row menus that change something (Restart, Scale, Optimize, Create New Alert…) need write access to the account; read-only users see the lists only.
- Feature switches and data sources. Some sub-tabs need a tenant feature (Anomaly, Upgrade Planner), Prometheus (PVC and Replica Rightsizing), a trace provider that supports them (Service Map, Trace Group, Cross-Zone) or a detected tool (Auto Scaler). Grafana appears only when the agent reports a Grafana connection and you have read access to the account. Each linked page describes these requirements.
Empty tables show No Data Available (or All good here! for recommendations).
Summary
The Summary tab is the cluster's front page:
- Cluster Summary — Nodes, Applications and Pods; Potential savings; SLO Status; Insights; Utilization & Health counts (Container restarts, Pending pods, Image not found, OOM, Unhealthy Statefulsets); and Quick Links to Query Logs, Recent Errors, Query Metrics, View Traces, Service Maps, View Applications, View Pods, Security and more.
- Events and optimizations — Events/Errors, Critical Events - By Type, Critical Events - Recent, API Errors, Automation, Optimization rules and Optimizations (including Workload right sizing), in their own block below Cluster Summary.
- Cost Summary — with a Frequency selector.
- Utilization — with a Frequency selector.
If part of the summary can't load (for example you lack access to recommendations), that block is skipped and the rest still shows.