Jaeger
Connect Jaeger so NudgeBee can read distributed traces and correlate latency and error spikes with the workloads behind them.
Prerequisites
- A reachable Jaeger Query service. NudgeBee reads traces through the Query API, not the collector.
- The Query API URL, typically on port
16686. - A bearer token, if your Jaeger deployment is behind authentication.
Step 1: Configure the Integration in NudgeBee
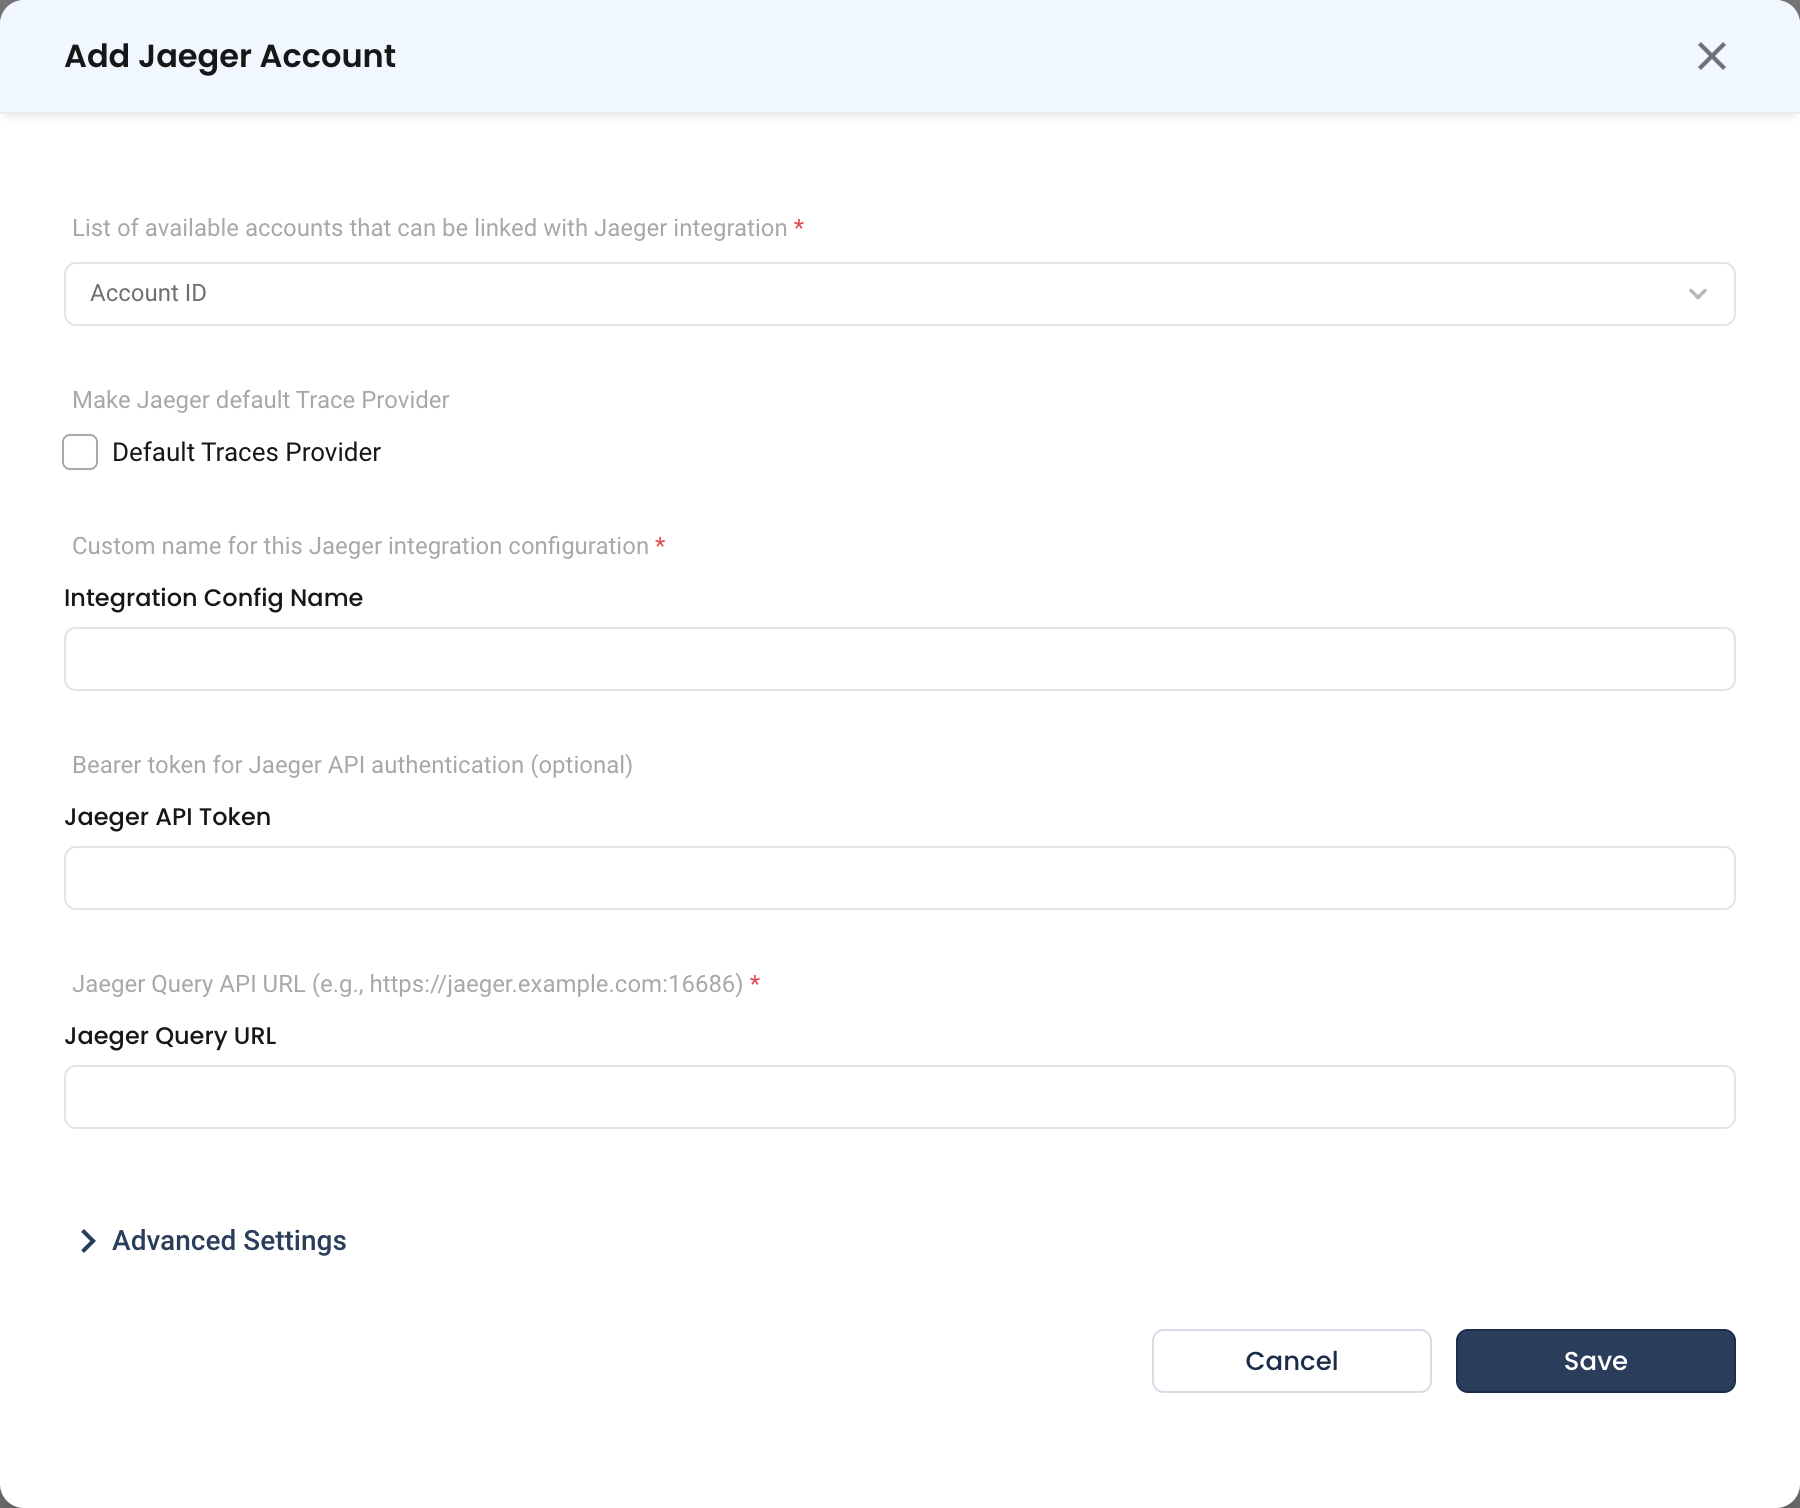
Navigate to Admin > Integrations > Observability, select Jaeger, then click Add Jaeger Account.

- Account ID * (Required)
- The NudgeBee account or accounts to link this Jaeger integration with.
- Default Traces Provider
- Enable to make Jaeger the default trace source for the selected accounts. Only one trace provider can be the default per cluster.
- Integration Config Name * (Required)
- A custom name for this configuration, e.g.
jaeger-prod.
- A custom name for this configuration, e.g.
- Jaeger API Token
- Bearer token for Jaeger API authentication. Optional — leave empty for an unauthenticated Query service.
- Jaeger Query URL * (Required)
- The Query API endpoint, e.g.
https://jaeger.example.com:16686. For an in-cluster deployment this is usually the Query service DNS name, e.g.http://jaeger-query.observability.svc.cluster.local:16686.
- The Query API endpoint, e.g.
Advanced Settings holds optional tuning for this integration.
Step 2: Save
Click Save.
What Gets Connected
| Signal | Source |
|---|---|
| Traces | Jaeger Query API — service and operation lists, trace search, and individual trace retrieval |
Jaeger is a trace-only source. Pair it with a metrics source such as Prometheus and a log source such as Loki for full troubleshooting context.
Verify the Integration
- Open Clusters, select a cluster, and go to Monitoring > Traces.
- Confirm spans appear for a service you know is receiving traffic.
- If the list is empty, check that the integration is enabled and set as the default trace provider for that cluster.
Troubleshooting
| Symptom | Likely Cause | Fix |
|---|---|---|
| No traces appear | Not set as the default trace provider | Enable Default Traces Provider for the cluster, or check which source currently holds it. |
| Connection fails | Collector endpoint used instead of Query | NudgeBee reads from Jaeger Query (typically 16686), not the collector (14268/4317). |
401 or 403 | Query API is behind auth | Supply a bearer token in Jaeger API Token. |
| Services list is empty | Traces are not reaching Jaeger, or the retention window has expired | Confirm your applications are exporting spans and that Jaeger's storage retains them. |
| Traces found but not linked to workloads | Span resource attributes do not identify the Kubernetes workload | Ensure your instrumentation sets service.name to match the workload name. |